Continuous behavioral monitoring

Your animals live 24 hours a day. How much of it do you see?

A scan sample catches minutes. xtrack watches every enclosure continuously, with no wearables, no clipboard and no observer effect. It turns that footage into welfare evidence: who is pacing, who is off feed, who never uses half their habitat, and what changed this week.

Seven days become one picture

One camera at Georgia Aquarium: 222,224 positions from seven days settle into the route this whale shark actually swims. It was flagged automatically as sustained one-direction circling, 63 laps an hour in the morning slowing to 41 by night. Click to replay.

Live today at Georgia Aquarium, Sea World Gold Coast and Merlin Entertainments

47×

more of every day on the record, per camera, than a thirty-minute scan sample

405 days since the first camera went live, 14 Aug 2025

Across 405 days, xtrack has reported on roughly 155 animal-years of behavior. A thirty-minute daily scan sample over the same period comes to roughly 3.3 animal-years.

99.91% device uptime, latest window

24/7 inference on the camera itself, at the enclosure

One camera's measured rate from a seven-day pilot week, extrapolated across 405 days of deployment and the 142 animals in a typical frame. The daily thirty-minute scan sample is credited the same 142 animals, so the comparison is fair.

01 · The instrument

An observer that never leaves the enclosure

A keeper can watch one exhibit for twenty minutes. xtrack watches all of them, all day, including the hours after your team goes home. The models run on the camera itself; what leaves the device is measurements, not footage.

Nothing touches your animals
No collars, tags or implants. No capture, no handling, no habituation period. The least invasive observation there is: a camera on a wall.
No observer effect, no sampling bias
Animals behave differently when someone stands at the glass. A fixed camera goes unnoticed, and it doesn't pick favorites, skip weekends, or sleep through the night shift.
Every individual, at once
One installation follows every animal in view at once, routinely more than 100 fish in a single reef frame, 249 at the busiest, or a whole colony, or a pair of bears mid-introduction. Every hour of it lands in a record you can query years later.
The model running live on an exhibit camera

Every fish in a reef exhibit, tracked at once, trails colored by speed. Detection and tracking at the edge; only the measurements travel. The same footage a keeper would glance at, watched without blinking.

02 · The dashboard

Know who needs attention before the morning round

Every enclosure on one screen: counts, welfare scores, alerts and trends, updated as the cameras watch. Every individual accrues its own behavioral baseline of activity by hour, habitat use, feeding response and social distance. It is deviation from that, not a generic threshold, that raises the alarm. And when the accreditation audit asks for welfare evidence, it has been collecting itself all along.

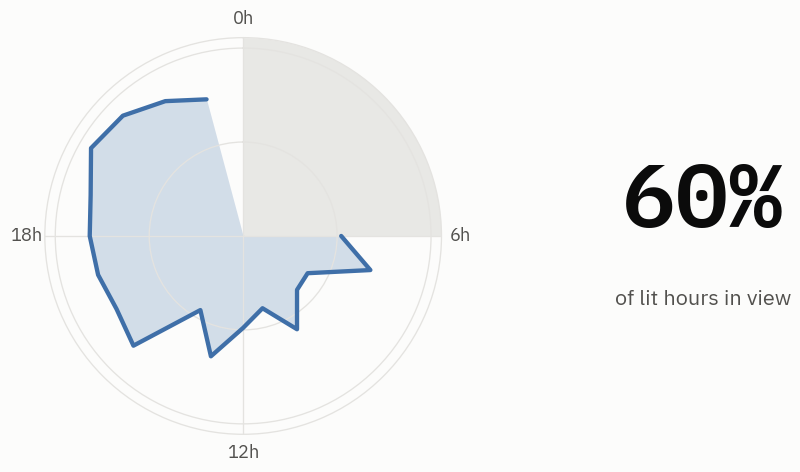
In view, by hour
A 24-hour polar clock of shark occupancy: evenings busy, a grey lights-off wedge, 60% of lit hours in view

A week of shark activity around the exhibit's own clock: when the day peaks, when it quiets, at a glance.

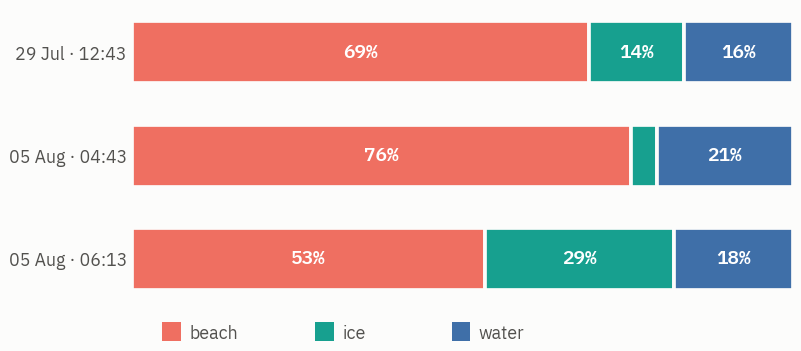
Where the time goes
Stacked time budget across beach, ice and water zones for three recording sessions

Habitat use zone by zone, from a penguin colony. It's the first readout keepers reach for.

Needs attention

motionless 45 min at an unusual site

seal 3 · back pool · 03:12 · on-call paged

activity 38% below her baseline, 3rd night

bear 2 · enclosure M2 · trend ↓

resolved · feeding engagement back to baseline

shark exhibit · 09:40

Alerts name the individual, the place and the trend, not just a number over a line.

When today doesn't look like every other day

Most animals mask illness. Behavior shifts days before anything clinical shows. Because every individual is measured against their own history, the quiet deviations surface early: appetite easing off across a week, a bird missing from her usual roost, pacing creeping up night after night. And the acute ones don't wait for morning. An animal motionless at an unusual place and hour pages the on-call keeper within minutes, at 3 a.m. as readily as at 3 p.m.

The Monday report, already written

Every week a report lands in the team's inbox: each animal against their own baseline, trends flagged, and the exact clips worth a human look, ready for rounds rather than another task after them. Monthly, the same record rolls up into a welfare report formatted for the committee and the accreditation file, with every animal set against its observation goal, activity budget and change since last month, and guidance written for whatever it flagged. Over years it becomes something rarer: objective quality-of-life trends for aging animals, so the hardest decisions in animal care rest on evidence rather than impressions.

Weeks become a picture: every day a row, every hour a column, with the one day that stopped looking like the others flagged. Sample data.

The flag, up close: one day against the animal's own typical range. The evening ran outside it for six hours. The alert went out within the first.

A real monthly report, exactly as it lands in the inbox. Generated automatically, names changed for privacy.
Every animal scored against clear welfare thresholds, and against last month. Exactly what the accreditation file asks for, collected all month without anyone lifting a pen.
What needs attention, who it affects, and what to try next, written for you before you even open the file.

03 · Ask

Answers before the meeting ends

You already have the questions. What you've been missing is the record. Ask in plain language and xtrack searches years of ethogram and tracking history, answering with maps, charts and statistics. No video review, no export, no weekend lost to a spreadsheet.

Where do yellow tangs prefer to hang out? Show me a heatmap.

"Yellow tangs strongly concentrate in the middle-right area of the reef. This is clearly their preferred hangout zone. […] Rather than roaming widely, these fish demonstrate a highly localized occupancy pattern, clustering tightly around their core territory. […] The tight concentration around the center-right region indicates strong territorial fidelity."

An actual answer, maps and all, generated in seconds from one reef exhibit's tracking history.

Which behaviors happen before stereotypies?

answered with a sequence query over the ethogram for what precedes, what follows and how often

Which enrichment items hold attention longest?

answered with engagement durations per item, per individual, ranked

Did the habitat redesign change how the space is used?

answered with before/after occupancy maps and a utilization curve

Assessing an abnormal behavior, planning an introduction, judging whether the redesign worked. Each one is minutes of analysis on your own animals, instead of weeks of manual scoring.

04 · Case studies

Where xtrack is running

Three live deployments, three very different problems: an exhibit too large for any human observer, the highest-stakes procedure in bear care, and a colony of near-identical birds. Everything below is measured, not projected.

Georgia Aquarium

Atlanta, United States

whale sharks · fish exhibit

A habitat too large for any human observer

Georgia Aquarium's flagship habitat holds whale sharks and thousands of fish in millions of gallons of water. No one can watch it whole, and dive teams see it minutes at a time. xtrack cameras watch it continuously, segmenting every animal in view on the camera itself and serving a live view back to the exhibit team.

  • 222,224 whale shark positions over seven days, every one a segmentation mask the camera produced on board
  • the same route on all seven days, the baseline any change will show against, plus 3,061 laps swept, 91% of them one way
  • posture read from the masks themselves: banking, turning and pace, hour by hour

What the camera sees, one week day by day: the same route worn in every single day, and how each hour splits between slow, steady and fast circling.

Sea World Gold Coast Australia

Gold Coast, Australia

polar bears · dolphins · seals

The highest-stakes moments in bear care, on the record

Introducing two polar bears is planned for months and, until now, assessed by eye. From Sea World's own archive, xtrack scored every introduction between the bears from 2022 to 2026 frame by frame. The same trajectory analysis now flags stereotypic pacing as it develops, with the dolphin lagoons and seal habitats next.

  • eight introductions scored in bear-lengths for approach, retreat, and time within touching distance, comparable across years
  • a pacing score computed from trajectory alone ranked all three clips a keeper labeled as pacing at 1, 2 and 3 of the 38 eligible clips
  • behavior models sized to run on the enclosure camera itself, around the clock

The 13 Dec 2025 introduction, in bear-lengths: terracotta stretches are the bears closing, dark ones opening. Inset: the closest approach, 0.35 bear-lengths.

Pacing draws a square wave; ordinary play wanders. One number, the rebound, separates them, and the map shows the line worn into the enclosure.

Merlin Entertainments

Sea Life attractions

penguin colonies

A whole colony, one bird at a time

A penguin colony defeats individual observation: dozens of near-identical birds, active around the clock. From a single fixed camera, xtrack turned two hours of footage into a colony-scale record of who is in the water, where the colony actually lives, and which spots individual birds keep returning to.

  • 564,226 positions from two hours of one camera, perspective-corrected into body lengths
  • five of seven standing sites recur across dates a week apart, which is site fidelity measured from video alone
  • half of all colony time happens in a few percent of the habitat, a hard baseline for enrichment and redesign

Who was doing how much, when: one row per bird, quiet to busy, with each bird's activity budget beside it. Rendered from the measured per-bird statistics.

Partner integration

OERCA

Inside the app your team already opens every morning

Oerca is where zoological and marine teams keep their world, from animal records and observation logs to water quality, feeds and training. xtrack integrates directly: our analytics appear in the Oerca dashboard your staff already know, attached to the animals and habitats they already describe. No new tool, no second login, no export.

Analytics on the animal's own record
Welfare scores, space-use maps and behavior alerts land next to the keeper notes and veterinary history, in the place where decisions about that animal are actually made.
Behavior, read against the environment
Salinity, water temperature, dissolved oxygen, lighting. The sensors Oerca already logs line up against the behavioral record. "Did activity change after the salinity drift?" becomes one overlay, not a week of data wrangling.
Husbandry, with the response measured
Enrichment, feeds, medication and training go into Oerca as they always have; xtrack adds what the animals did next: engagement, appetite, and activity against each individual's own baseline, so every intervention gets a measured answer.
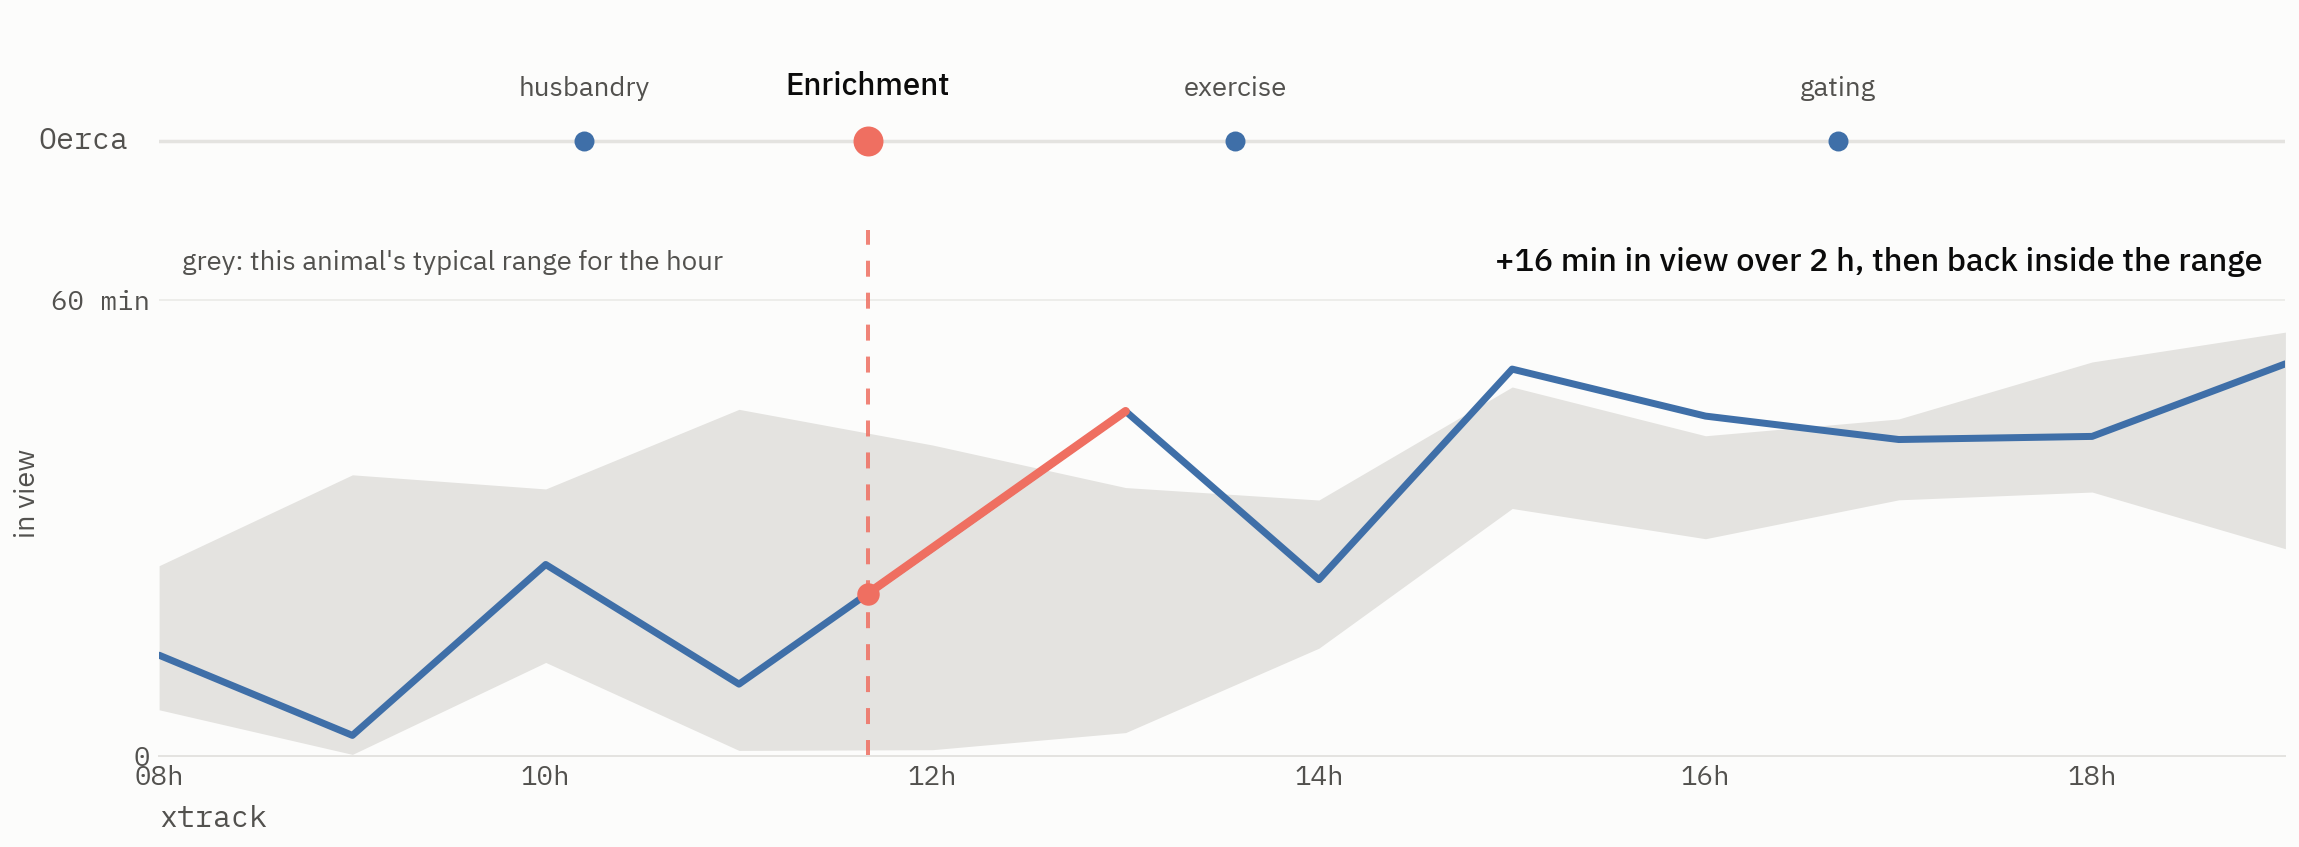
A day of husbandry events along an Oerca timeline with an enrichment session marked, and beneath it the animal's activity rising out of its own typical range for two hours afterwards before returning

Oerca records when the enrichment went in; xtrack shows what the animal did next, two hours of activity above its typical range for that time of day. Every intervention gets a measured answer. Sample data, from one animal's real logged day.

05 · In the field

One instrument, many kinds of care

Zoos and aquariums are where xtrack runs today. But the same cameras, models and baselines apply wherever animals live in someone's care, and wherever the questions sound like these.

05.1Zoos & aquariums
Catch a stereotypy while it is still a rare event, not an established habit. Walk into a high-stakes introduction with data instead of a committee's best guess. And hand the accreditation review a continuous welfare record, not a sampling protocol.
05.2Aquaculture
Feeding response and swimming behavior across the whole stock, continuously. Stress and disease show up in behavior days before they show up as mortality.
05.3Shelters & rescue
How a rescue settles on its first night, who guards the food bowl, which pairings actually work. It's the overnight record that shortens rehabilitation and makes better-matched adoptions.
05.4Veterinary care
Recovery measured against the animal's own baseline (activity, appetite, movement), so intervention happens when the data moves, not at the next scheduled check.
05.5Conservation
Counts and distributions in the wild without trapping or tagging a single animal, updated in real time. A defensible measure of whether protection is actually working.
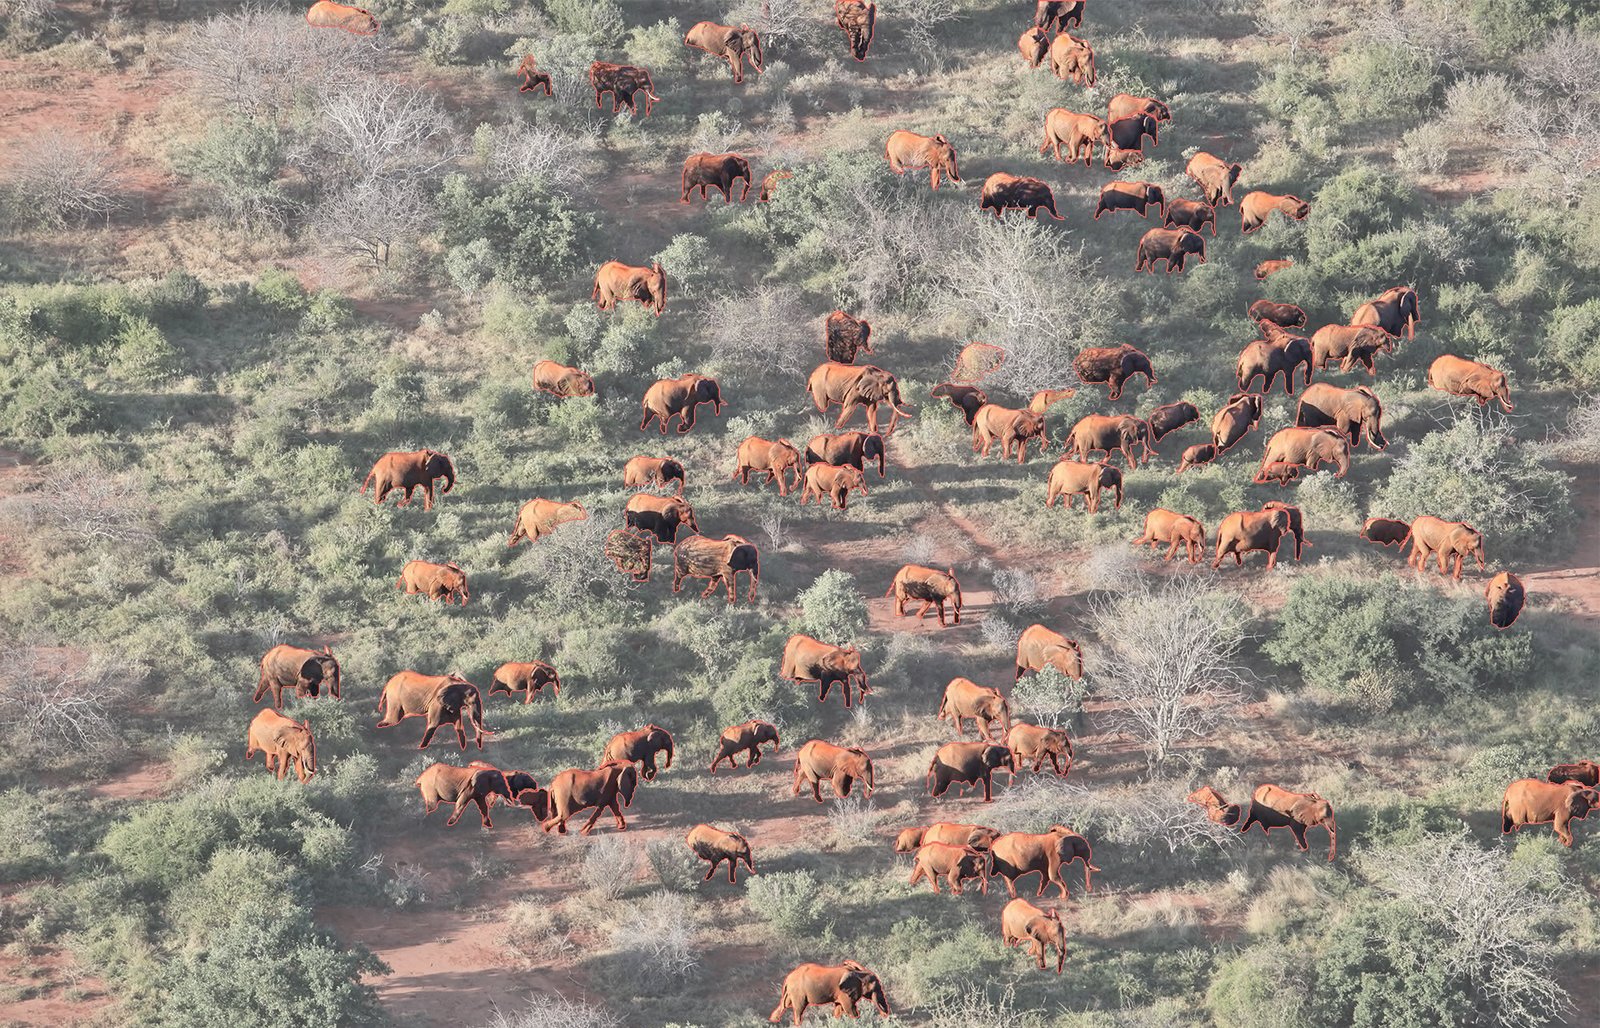
Aerial photograph of a savanna elephant herd; every elephant is cut out in full color by its segmentation mask against a muted background, each rimmed in terracotta
fig. 3 · counted from the air: 89 elephants in one frame, none collared
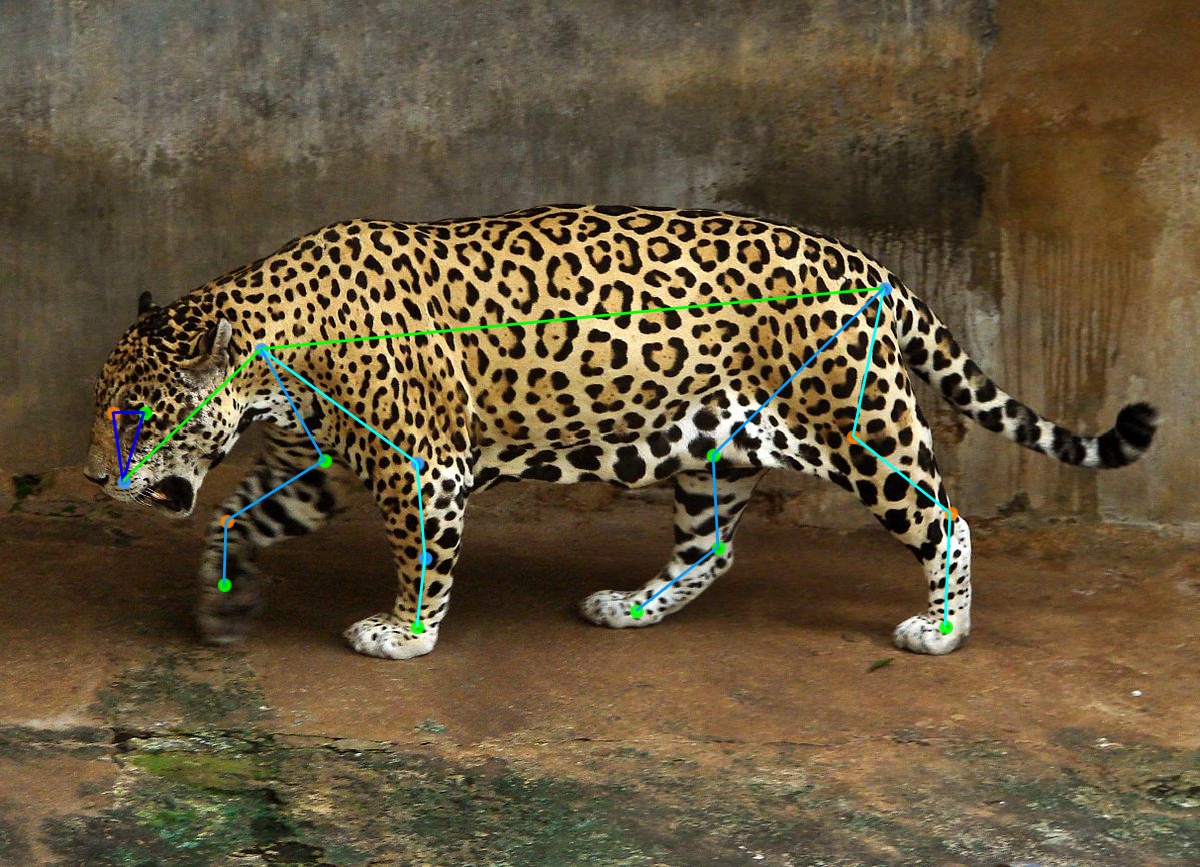
A leopard photographed by a camera trap
fig. 4 · the same models, pointed at the wild

In development

A health check, logged while both hands hold the animal

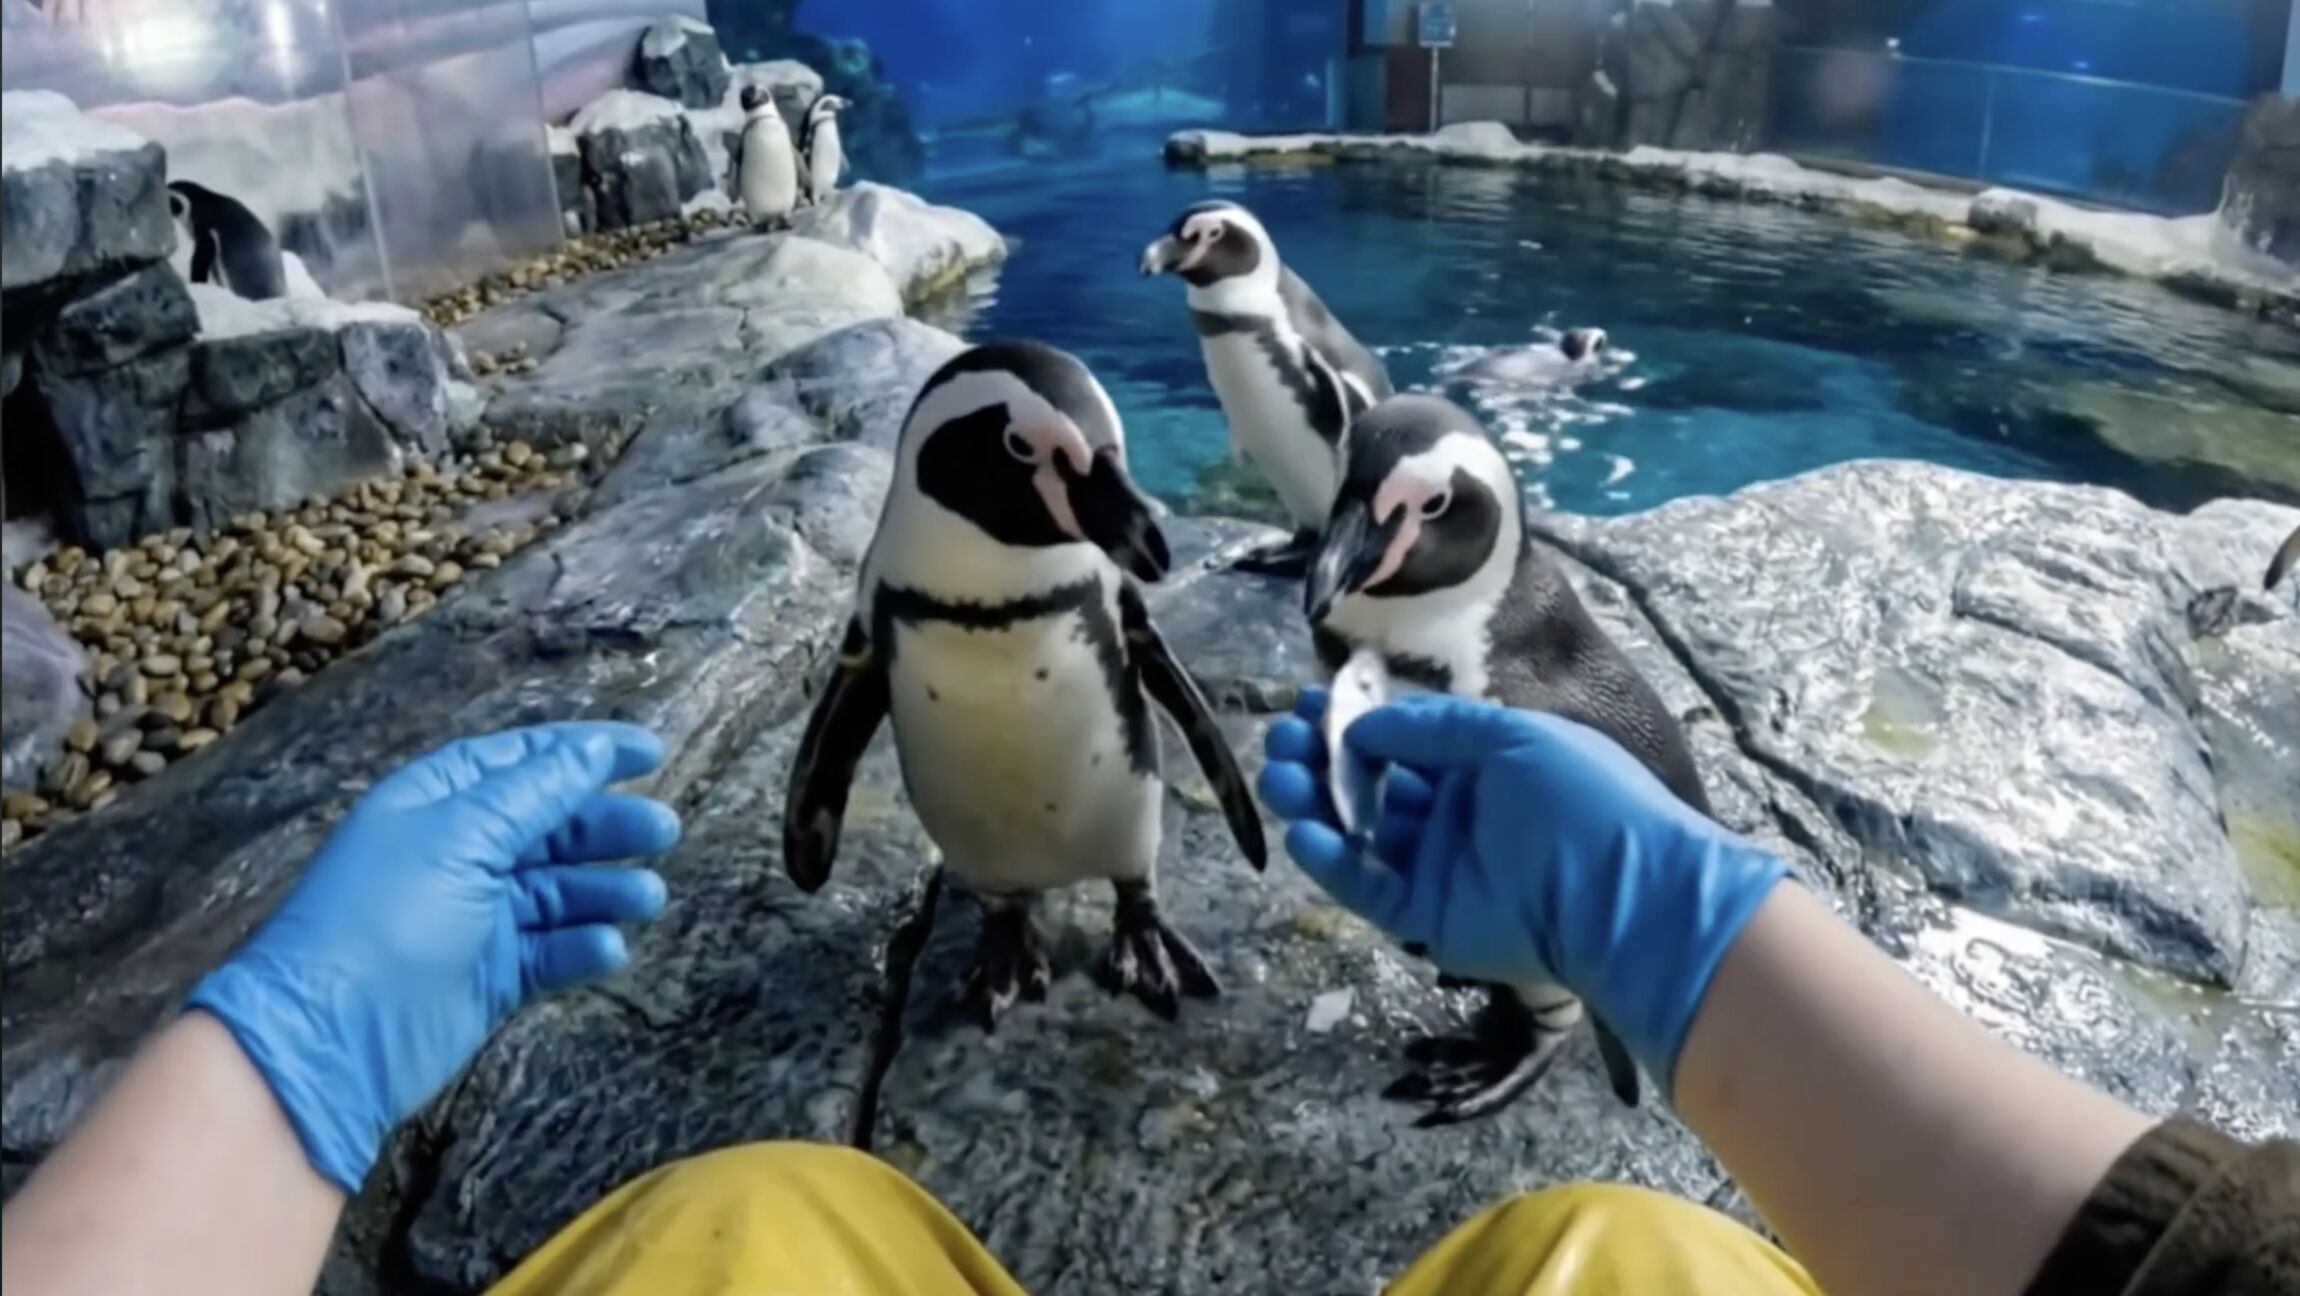
The cameras report on the enclosure; the next instrument is worn. We are building smart glasses that put the record where the work happens. What a keeper sees and says during a feed or a health check attaches itself to that animal's history on the spot. The same recognition models, looking where you look. No clipboard, no end-of-day data entry.

First-person view through smart glasses during a penguin feed: the keeper's gloved hands in front, the colony gathered on the rocks at the pool's edge
Concept visualization of hands-free reporting, in development.

Request a demo

Find out what your animals do when nobody is watching.

A thirty-minute walkthrough of a live deployment: the cameras, the dashboard, and the week of behavior your enclosures are producing right now, unrecorded.

Request a demo

the dolphin lagoon by drone · Sea World Gold Coast